| |
 |
About
Previewer |
|
Previewer
is a Seward Consulting Ltd. product which produces demonstration
data for presentation in POWERPLAY, a Cognos
business intelligence tool.
POWERPLAY is a Business Intelligence (BI) product which
uses cubes to organize data about a business, normally
extracted from or resident in a relational database, for
analysis and presentation.
The
POWERPLAY cube is a simple model of data organization.
Those fields in a database whose contents appear in a
cube are divided into two classes, dimensions and measures.
A dimension is a field like "District Office",
"Month sold", "Salesperson", or "Product
type". It serves to label the record in which it
is found. The possible values in that field are known
as categories. A measure is a field like "Total sales",
"Expenditures", or "Units sold". It
contains a numeric quantity, and one for which totals
and subtotals are meaningful.
In
addition to actual values of the field specified as a
dimension, other values are also accepted as categories.
The categories for a dimension form a tree, and only the
lowest-level nodes of that tree are the actual field values.
Also, each category has a full name as well as an internal
code. Thus, a cube contains summarized information that
would be stored in multiple tables in a normalized production
database.
With
Previewer a user can quickly and easily define what a
cube should look like in terms of dimensions, measures
and overall percentages at each level in the dimension
hierarchy. Previewer uses the resulting model to generate
data points which can then be converted to POWERPLAY cubes.
Cubes created by Previewer are generated randomly but
constrained to the specified percentages. In most cases,
Previewer cubes are virtually indistinguishable from cubes
based on actual production data.
|
 |
|
| |
|
How
Does Previewer Work? |
|
Whereas someone uses POWERPLAY to enhance their knowledge
of a business, someone can use Previewer and his knowledge
of the business to create fabricated POWERPLAY cubes that
look realistic.
The
principle behind Previewer is that you set up the structure
of each dimension and measure and then you enter the relative
weightings at the various levels in the dimension hierarchy.
This weighting information, called "percentages",
is used by Previewer in the actual generation of cubes.
By specifying the percentages you can influence how the
cube will be generated. The only rule is that at each
level the total weighting has to add up to 100%. For example,
the years dimension, 100%, might be composed of the following:
1998 (25%), 1999 (25%), and 2000 (50%). You could further
split each year into quarters with their own respective
percentages reflecting the overall trends of the business
model.
You
also specify for each measure a total value. For example,
the Sales measure might be $2,545,000 and the Cost measure
might be $1,914,000. Previewer uses these amounts and
randomly generates points that are constrained by the
percentage values associated with each level in the hierarchy.
|
|
|
| |
|
What
Can Previewer be Used For? |
|
Previewer can be used to demonstrate the operation of
Business Intelligence technology on data customized to
an individual customer's operation without the need for
the lengthy preparations to connect to actual live databases.
This provides pre-sales reps of POWERPLAY products the
ability to quickly show the technology based solely on
prior knowledge of the business.
Another
use of Previewer is in creating industry vertical demos.
POWERPLAY portals and sales kits based on Previewer cubes
or star-schemas can be constructed efficiently and without
the problems connected with the sourcing of proprietary
data. Previewer also has the ability to reverse engineer
cubes so that existing POWERPLAY data can be leveraged
into the sales cycle.
In
many situations Previewer can also be used by end-users
of POWERPLAY to prototype new cubes or adjust existing
cubes before resources are expended in applying the changes
in the source data mart or data warehouse.
|
|
|
| |
|
Current
Supported Features of Previewer |
|
The following are major features currently support by
Previewer 2.0:
•
Intuitive user interface.
• Maintenance of Dimension and Measure hierarchies.
• Percentage bars for specifying relative differences
between Categories.
• Reverse engineering of existing cubes.
• Measures that can be defined in terms of other
measures.
• Importing of dimensions from other cubes.
• Facility for creating star schemas in any ODBC
database.
• Control of irregularity at the cube and dimension
levels.
|
|
|
| |
|
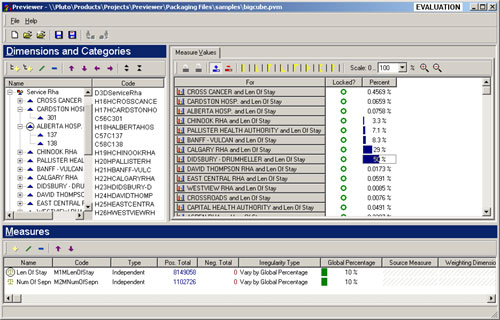
The
Previewer User Interface |
|
The following is a screen snapshot of the Previewer interface:
|
|
|
|